Codanimation with Snakes! ✨🐍
Trying to get a graph to “animate” is one of the most common needs I have personally come across time and time again, while working with countless physical and virtual engineering systems. Most programming languages, visualization & analytics software packages and associated IDEs have built in methods of providing access to such functionality. Sometimes though you have to resort to external libraries and packages to use nicer APIs and charting implementations to get a quick prototype to work.
A couple days ago while working with one such system we came across the exact same need. We were using some usual Python scripts to perform some model based optimization on collected data and showing it on a graph to get a sense of how well our algorithms were performing.
We had been through a bunch of iterations in order test the algorithm in static cases, and wanted to test the algorithm in dynamic situations. We had been using the matplotlib packages to perform most of the charting and wanted to continue using that for the dynamic cases.
While looking for a quick and easy solution we came across a bunch of different options. Here is one that worked, so in case if anyone is in a similar situation, here it is!
import matplotlib.pyplot as plt

plt.ion()

class AnimatePlot():
    #setup all the plot related init stuff here
    def __init__(self, min_x, max_x, min_y, max_y):
        self.min_x, self.max_x, self.min_y, self.max_y = min_x, max_x, min_y, max_y
        self.figure, self.ax = plt.subplots()
        self.lines, = self.ax.plot([],[], '-')
        self.ax.set_autoscaley_on(True)
        self.ax.set_xlim(min_x, max_x)
        self.ax.set_ylim(min_y, max_y)

    #this is what every iteration will run
    def update(self, xdata, ydata):
        self.lines.set_xdata(xdata)
        self.lines.set_ydata(ydata)
        self.ax.relim()
        self.ax.autoscale_view()
        self.figure.canvas.draw()
        self.figure.canvas.flush_events()

    #actual data fetch/manipulation here
    def __call__(self, plotter):
        plotter(self)

####
# this is just an example of how to use the above AnimatePlot class
import numpy as np
import time

def generate_data(plot):
    xdata = np.linspace(plot.min_x, plot.max_x, 1000, endpoint=True)
    ydata = []
    #this can be in an infinte while loop or for a specific number of seconds
    for a in np.arange(1,10,0.05):
        f = lambda x: a*x**2 + 2*a*x + 3
        ydata = list(map(f, xdata))
        plot.update(xdata, ydata)
        time.sleep(0.01) #mimics the delay in the data manipulation

p = AnimatePlot(0, 600, 0, 1000000)
p(generate_data)
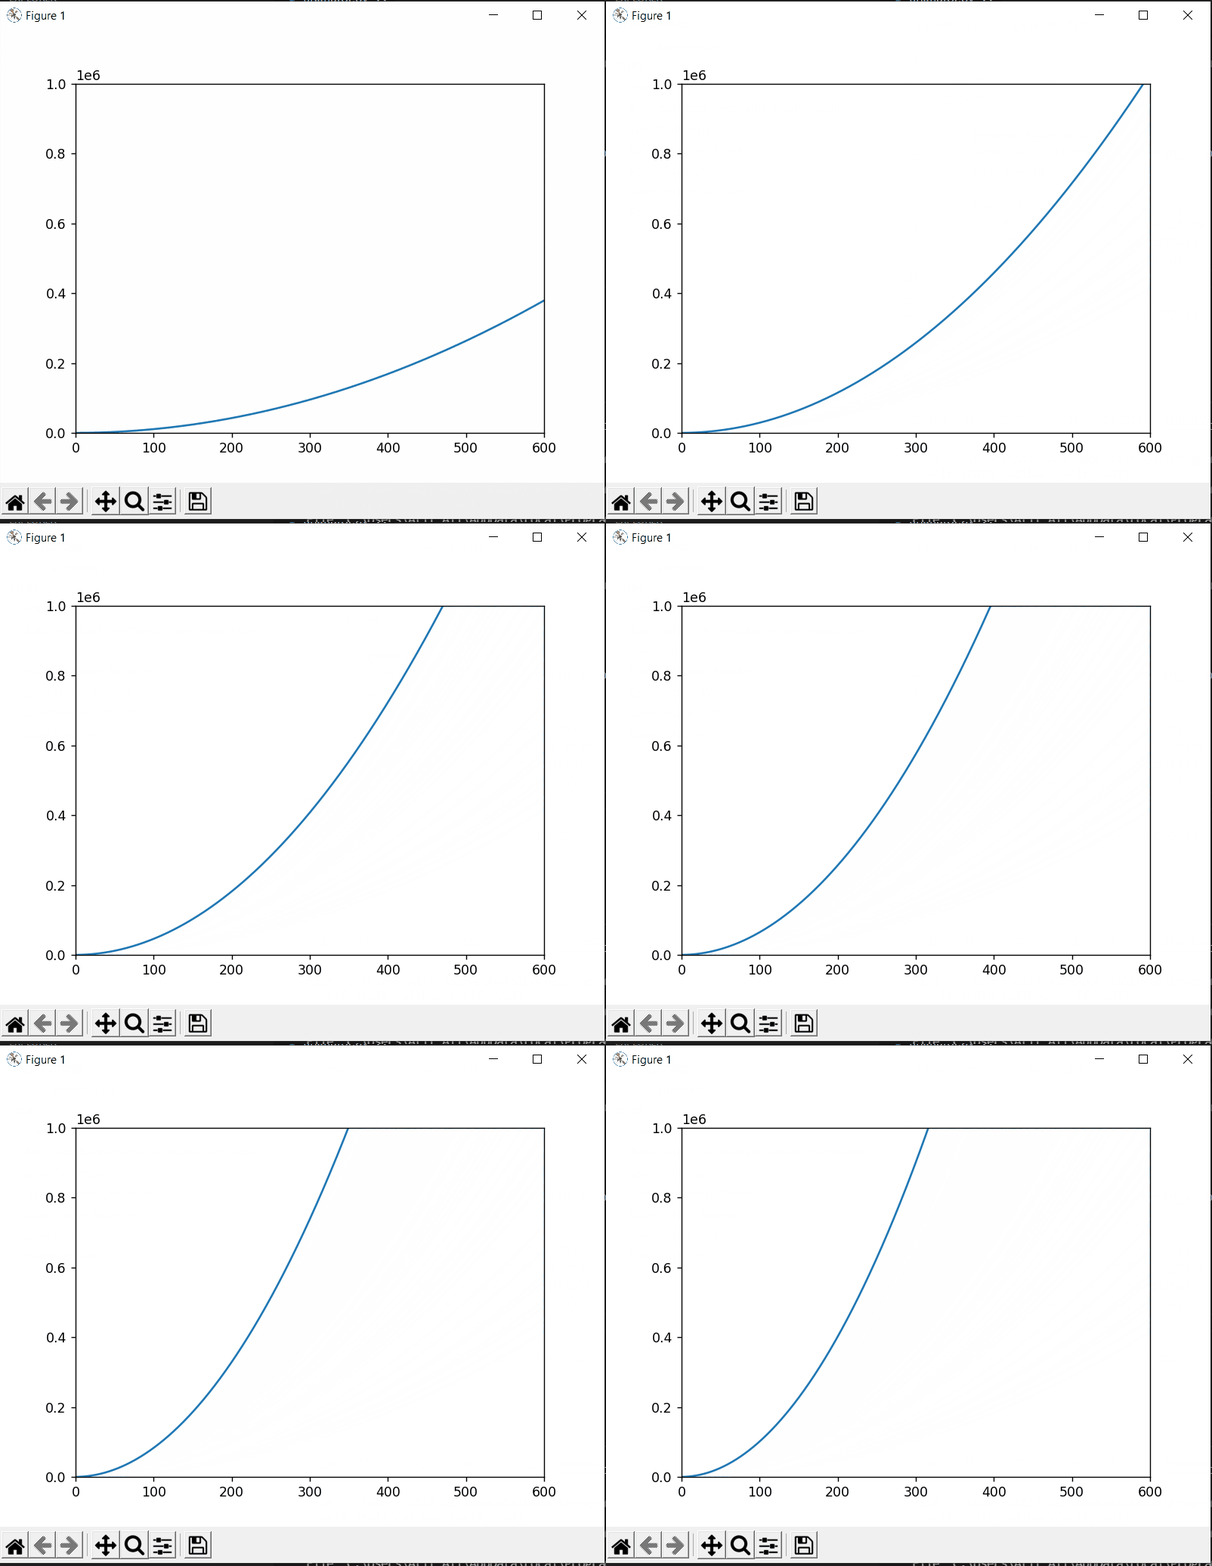
The above example data gives us the nice animation as shown below.

Well, definitely not the most optimized or complete implementation. Maybe there are better approaches out there too.
But this should be a nice quick and dirty solution to use in cases where a graph needs to be adjusted to take into account dynamic data updates. Some additional functionalities could also be built on top of this. Or maybe I am just re-inventing the wheel here without knowing 😅
If there is a better solution please leave some comments below!